Coursework in Visual Storytelling
A collection of coursework projects exploring how information can be organized, visualized, and presented through timelines, mapping, data visualization, and interactive presentation formats.
Exploring Different Ways to Present Information
This page brings together several information design coursework projects focused on visual storytelling, data organization, and audience understanding.
Each project explores a different method for presenting information, including timeline-based narratives, mapping, personal data visualization, and interactive presentation.
Rather than functioning as one large system project, this collection shows my practice with structure, hierarchy, sequencing, and visual communication across multiple class assignments.
View Live ProjectWhat this collection includes
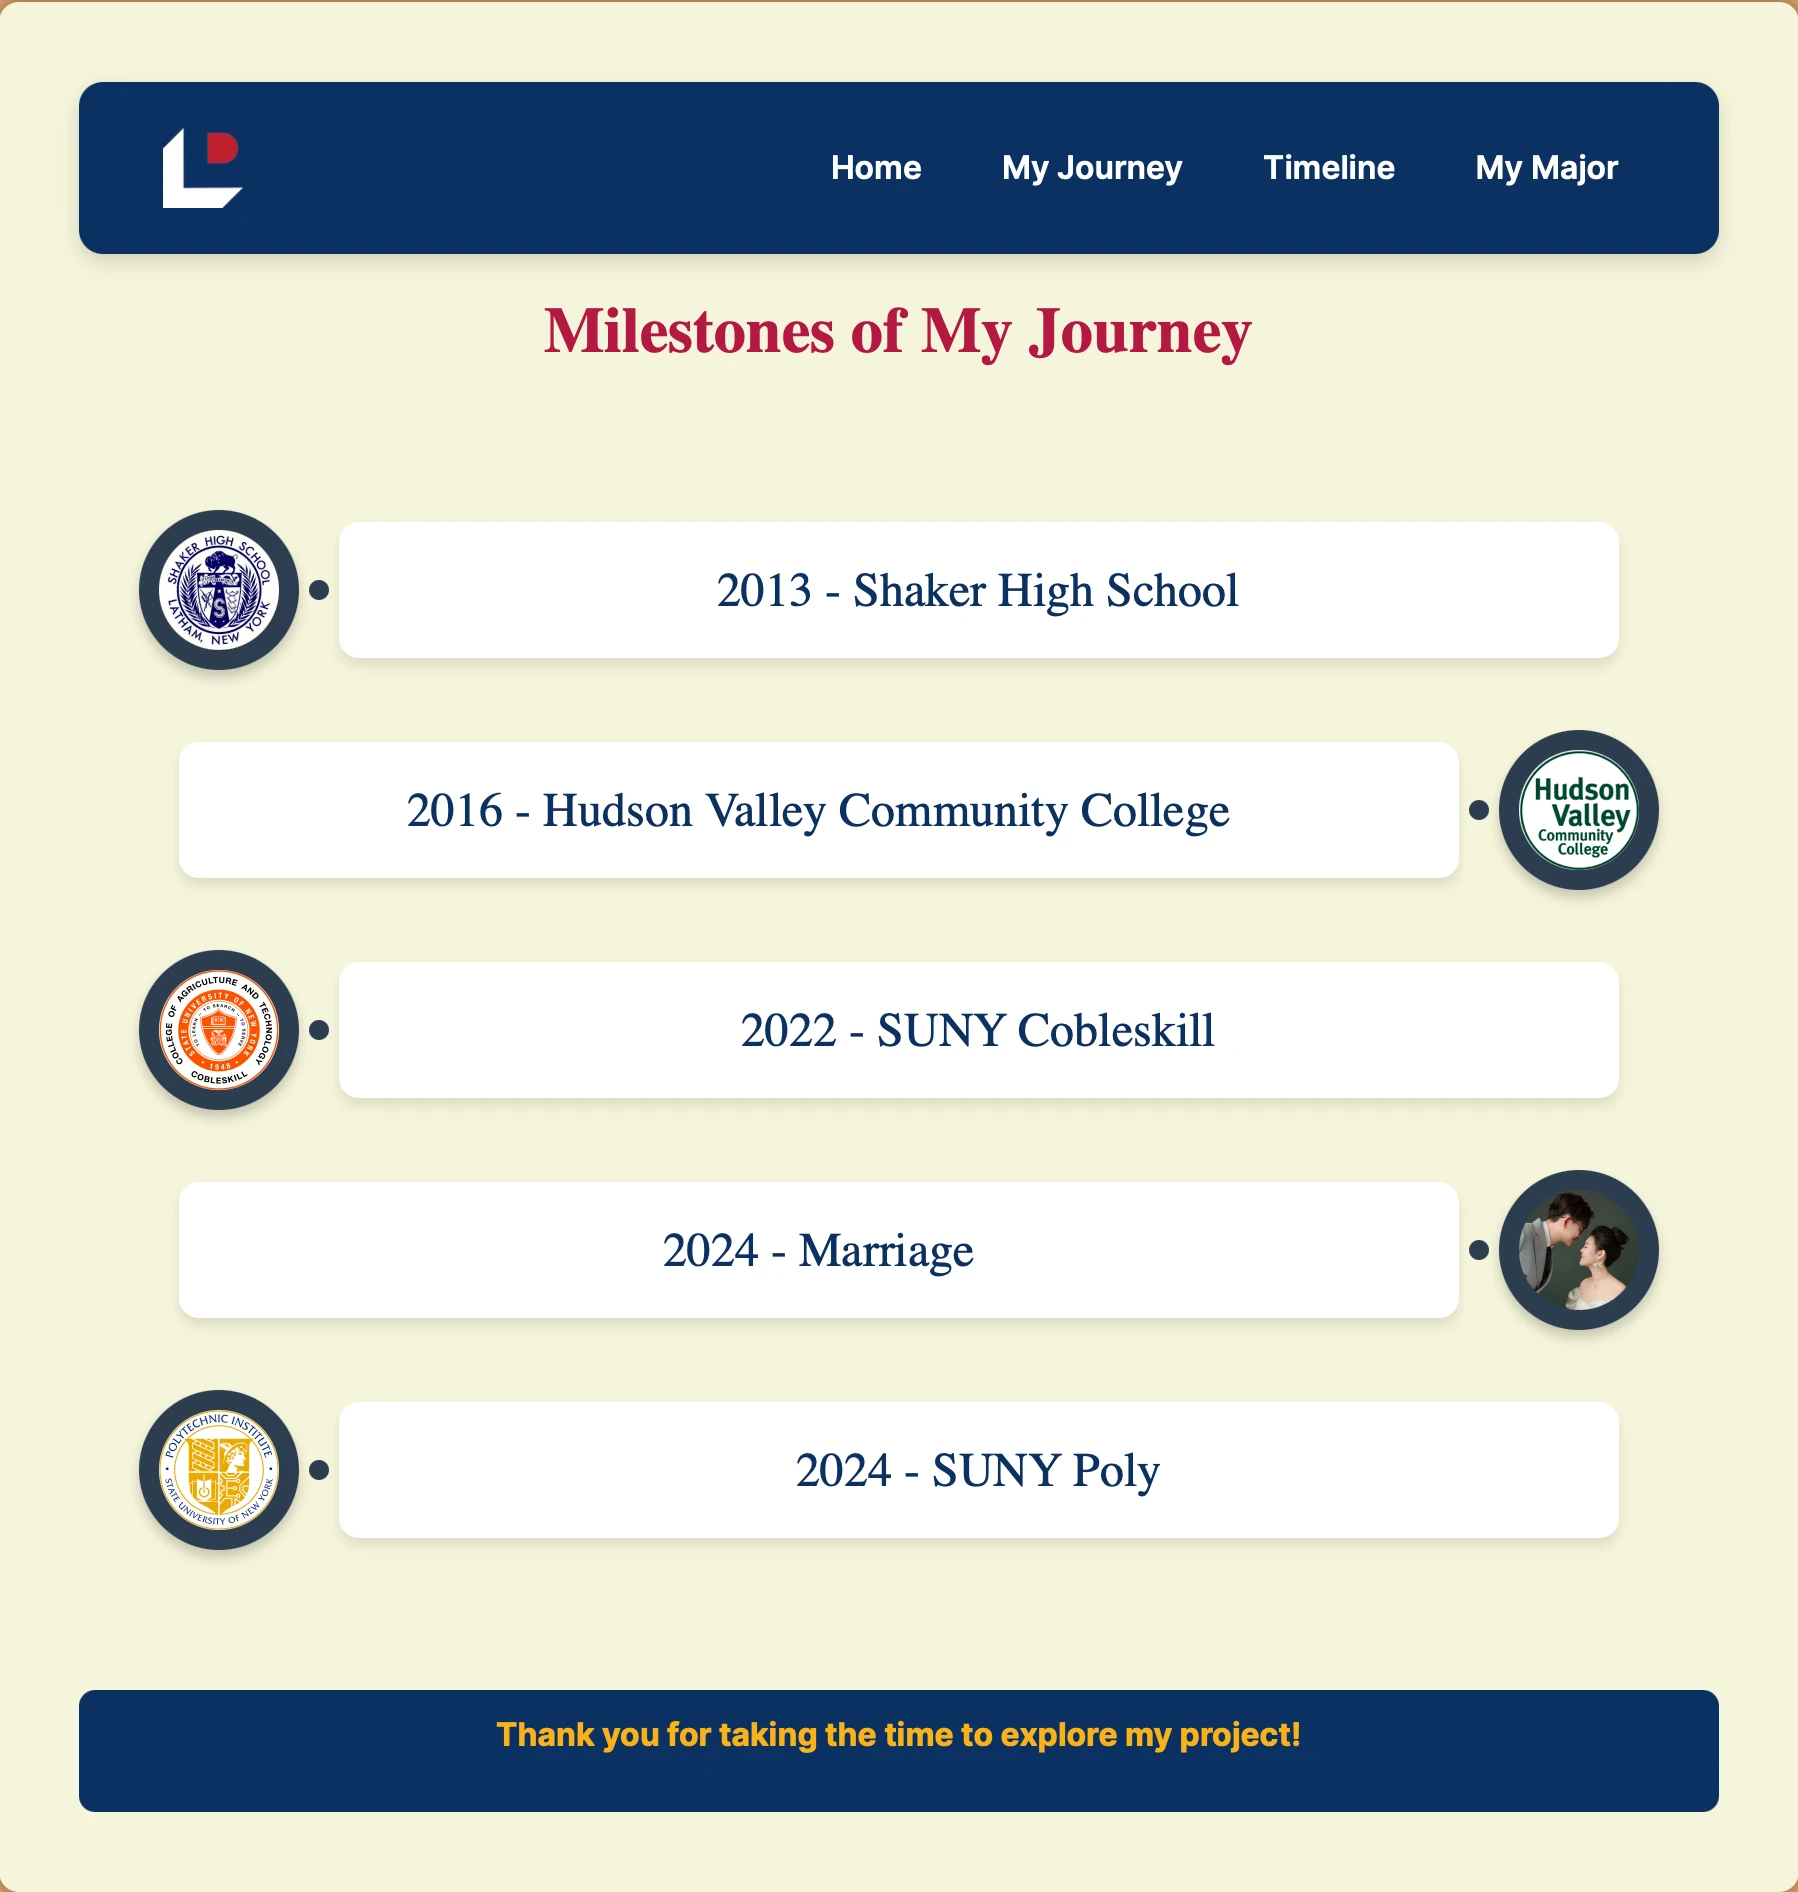
- Timeline-based storytelling and personal journey visualization
- Mapping and spatial organization of information
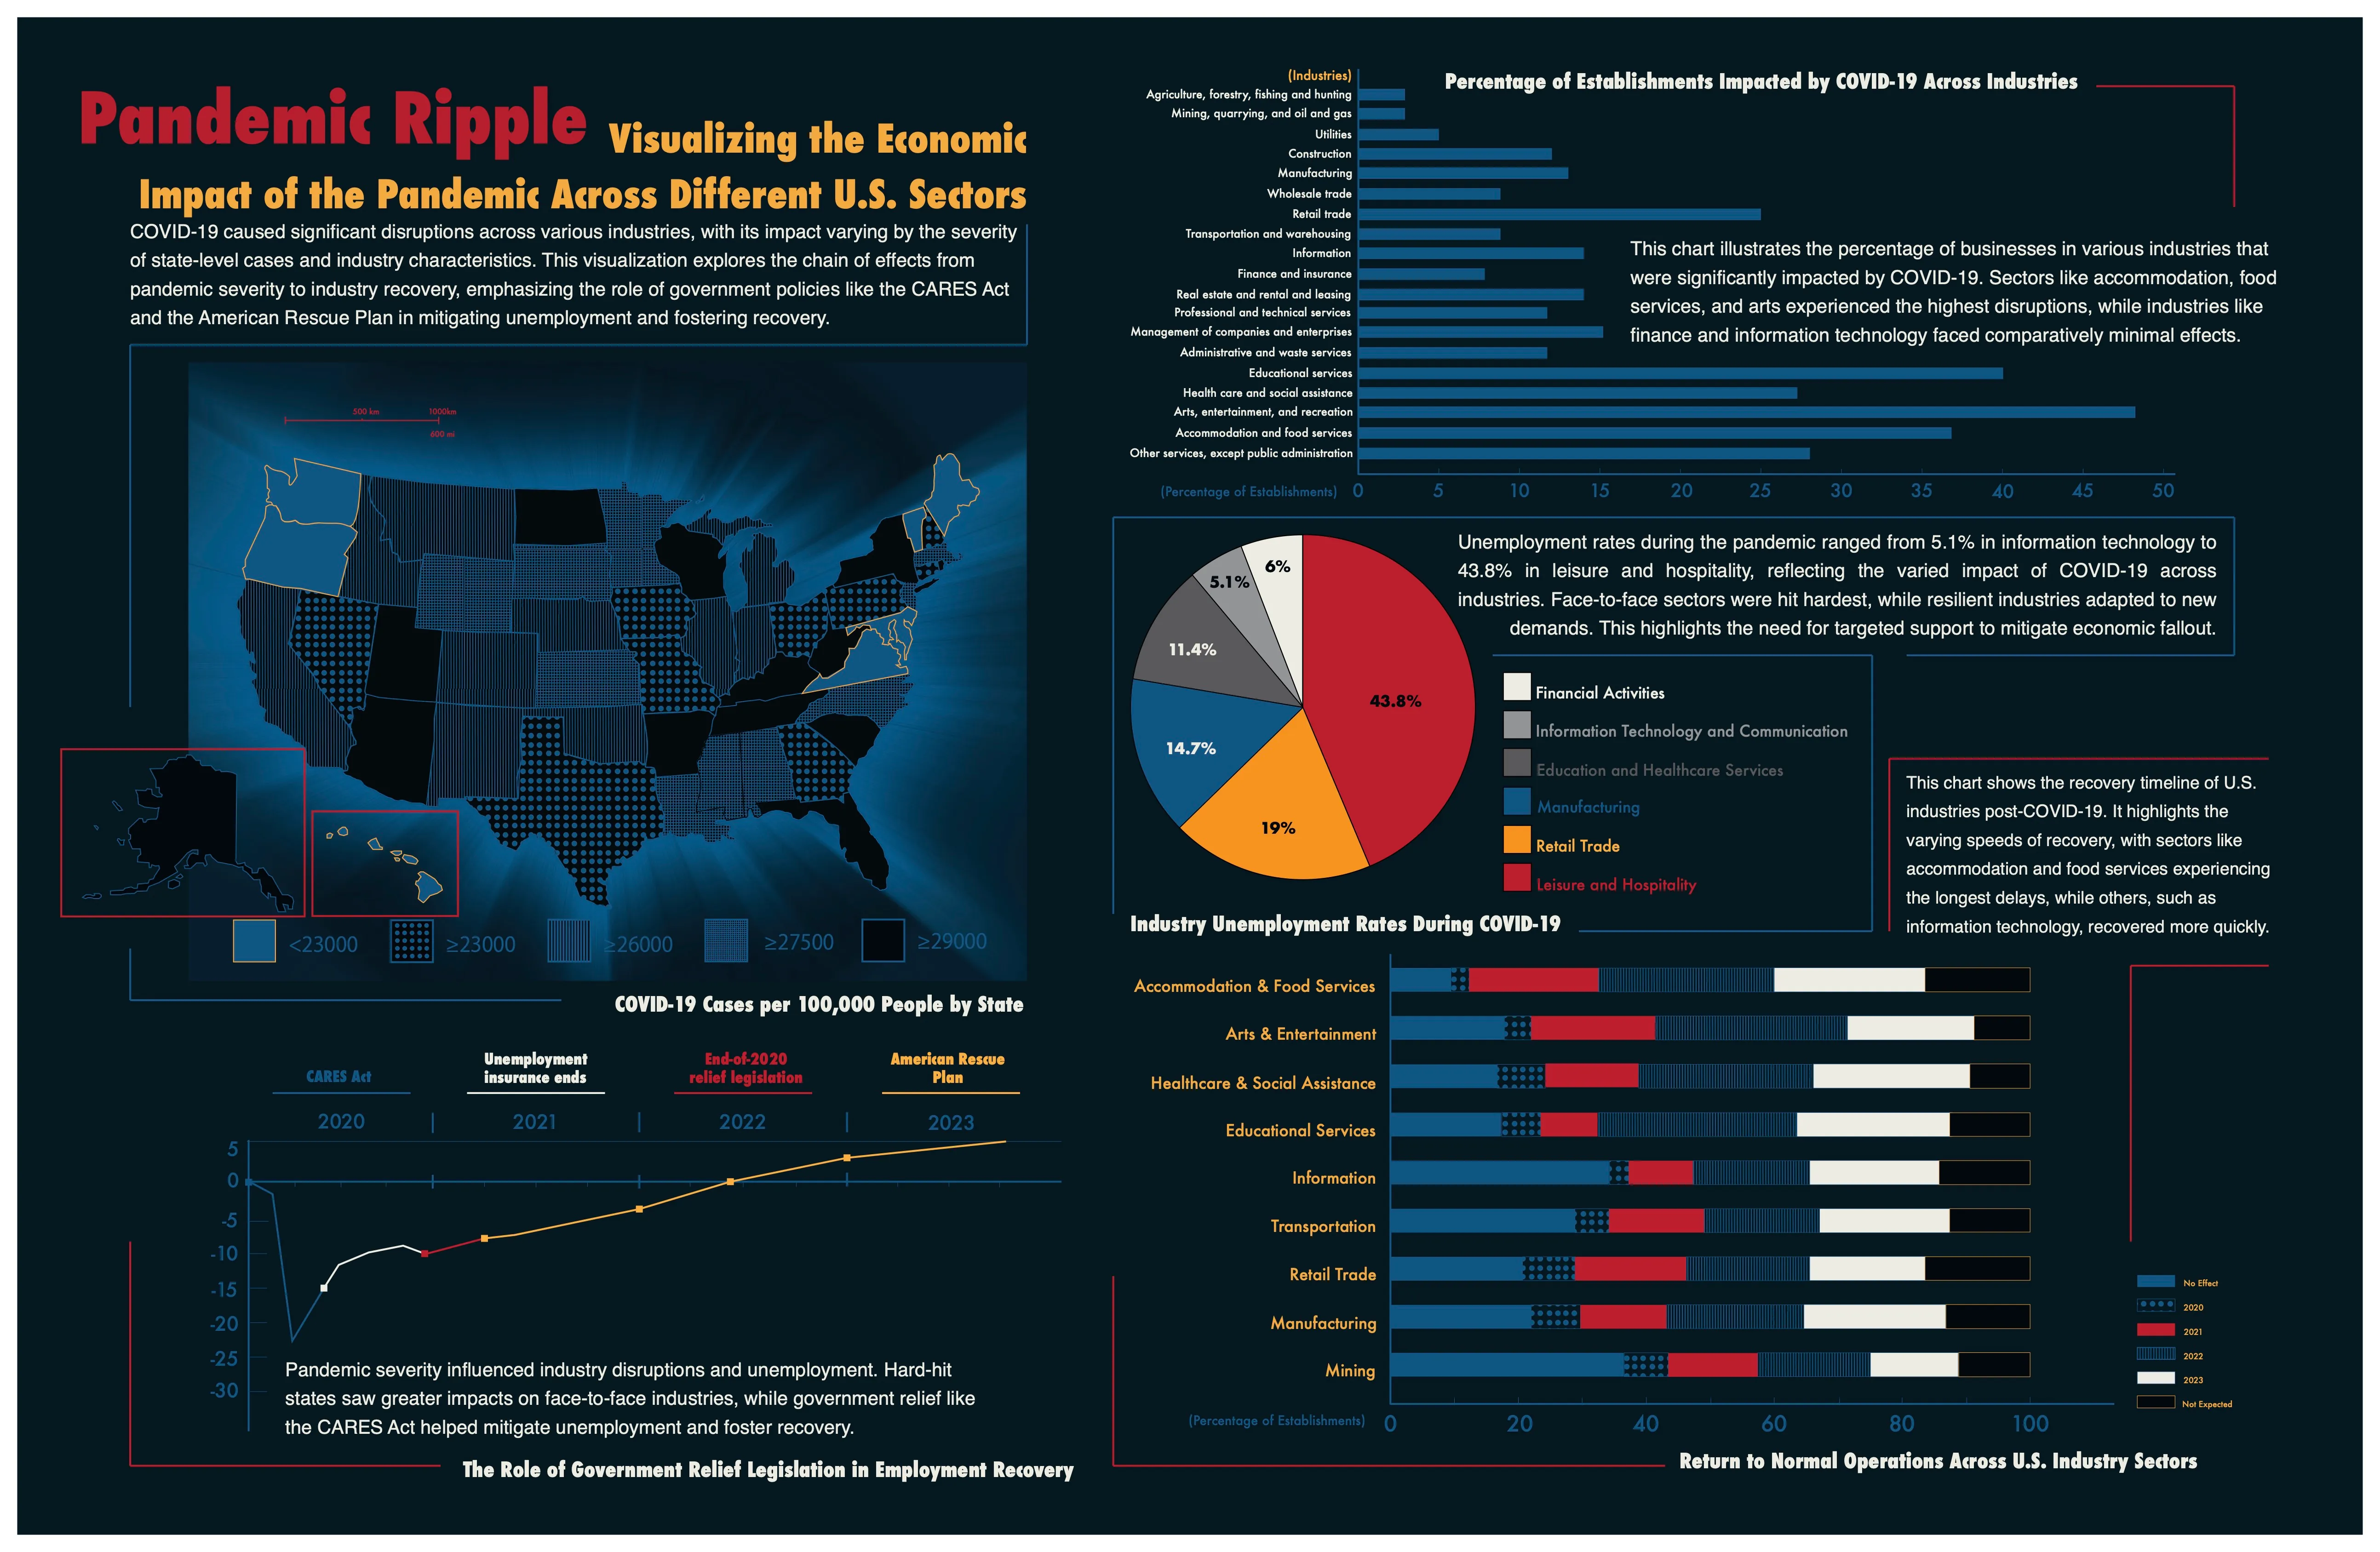
- Data visualization using hierarchy, grouping, and sequencing
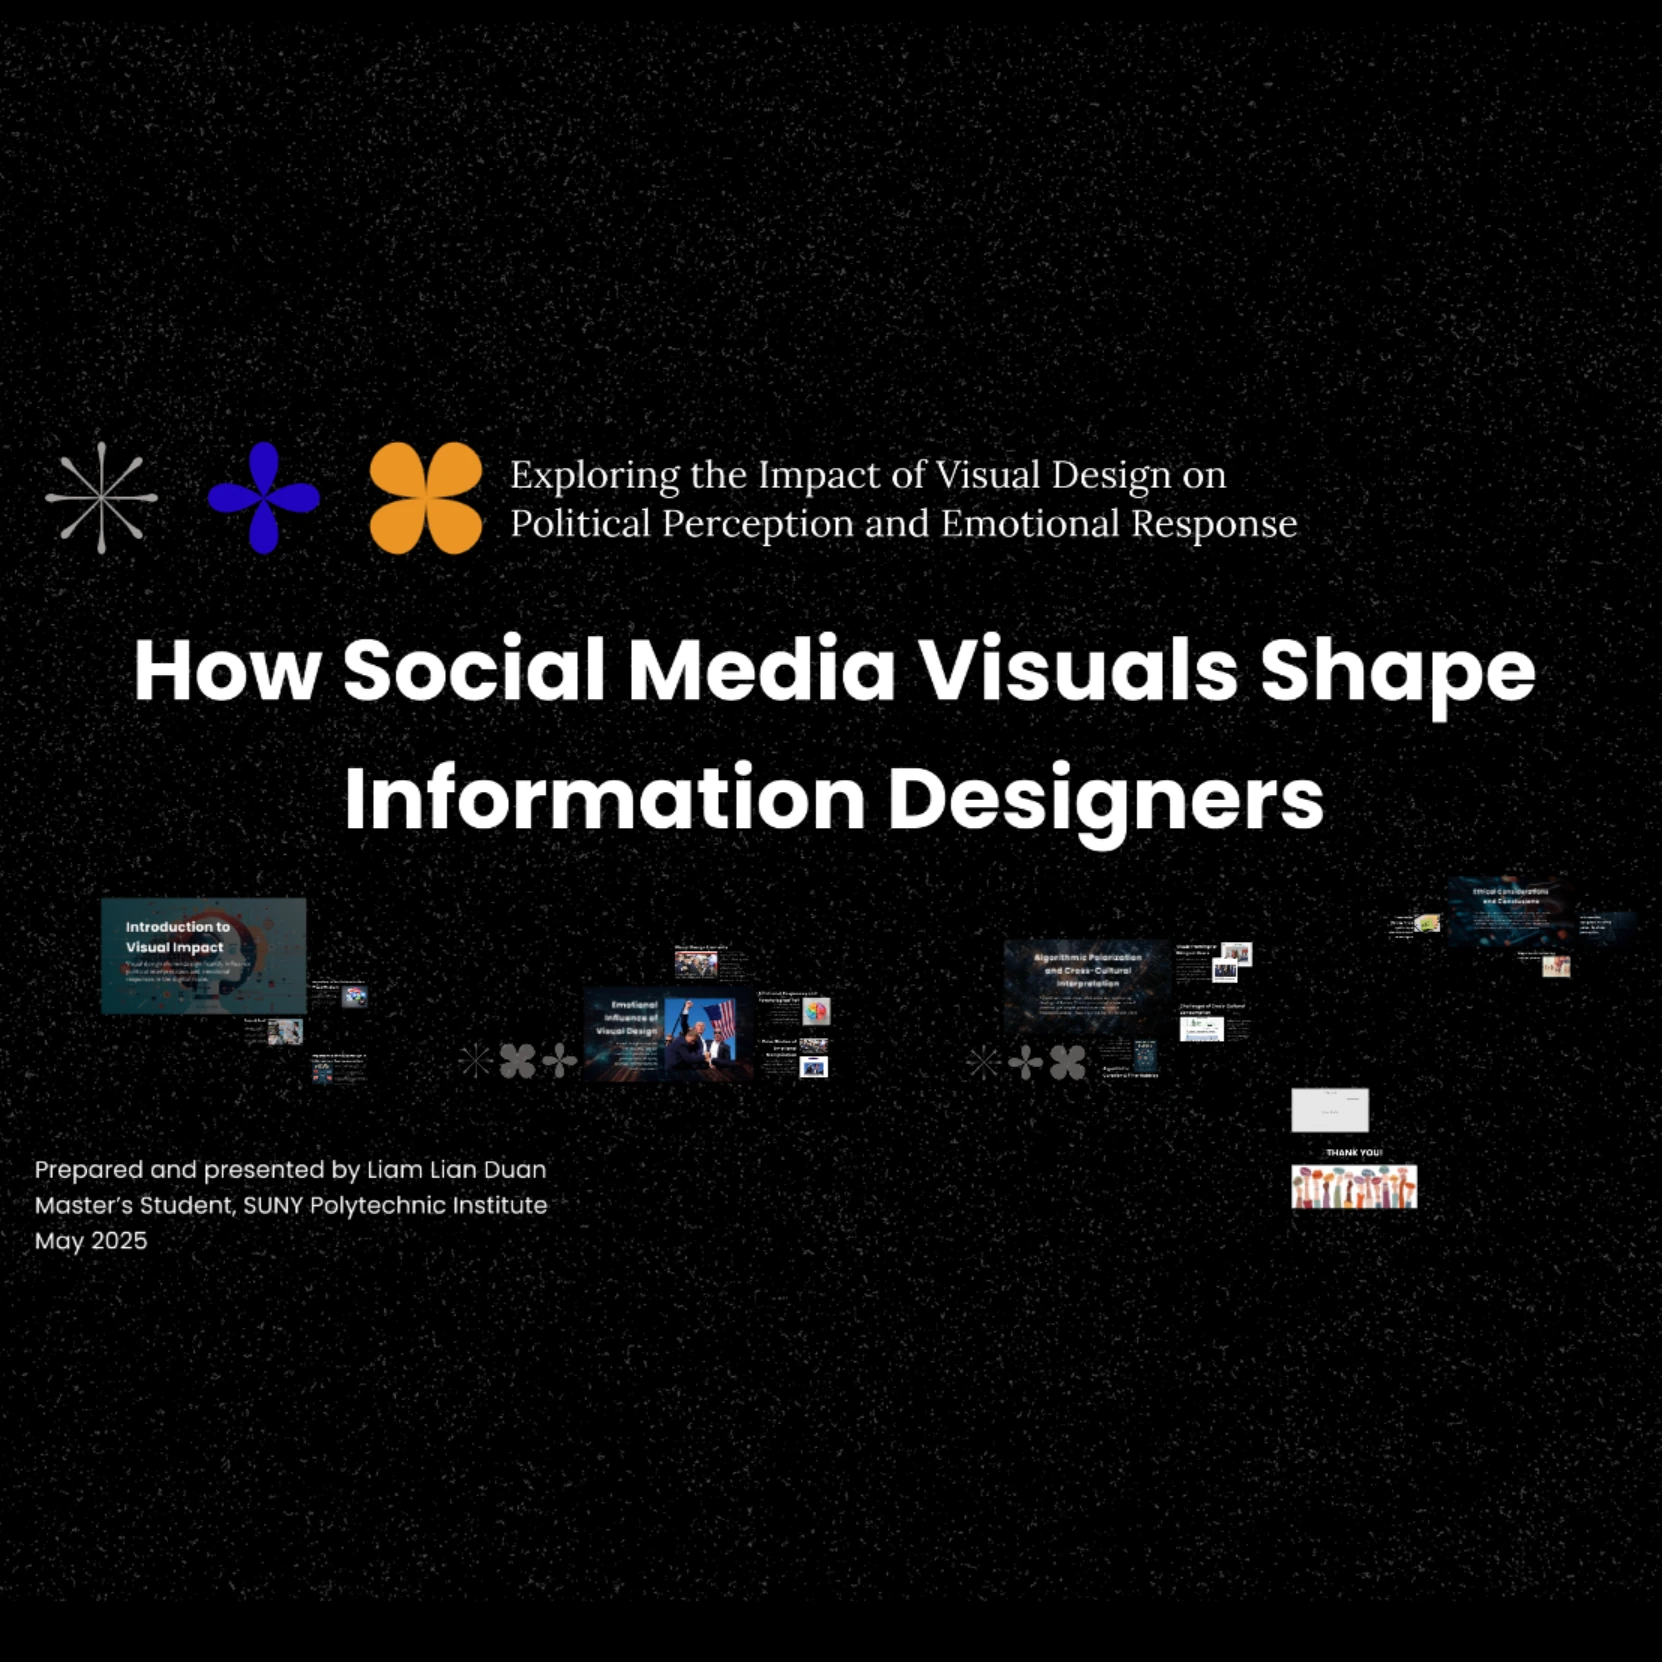
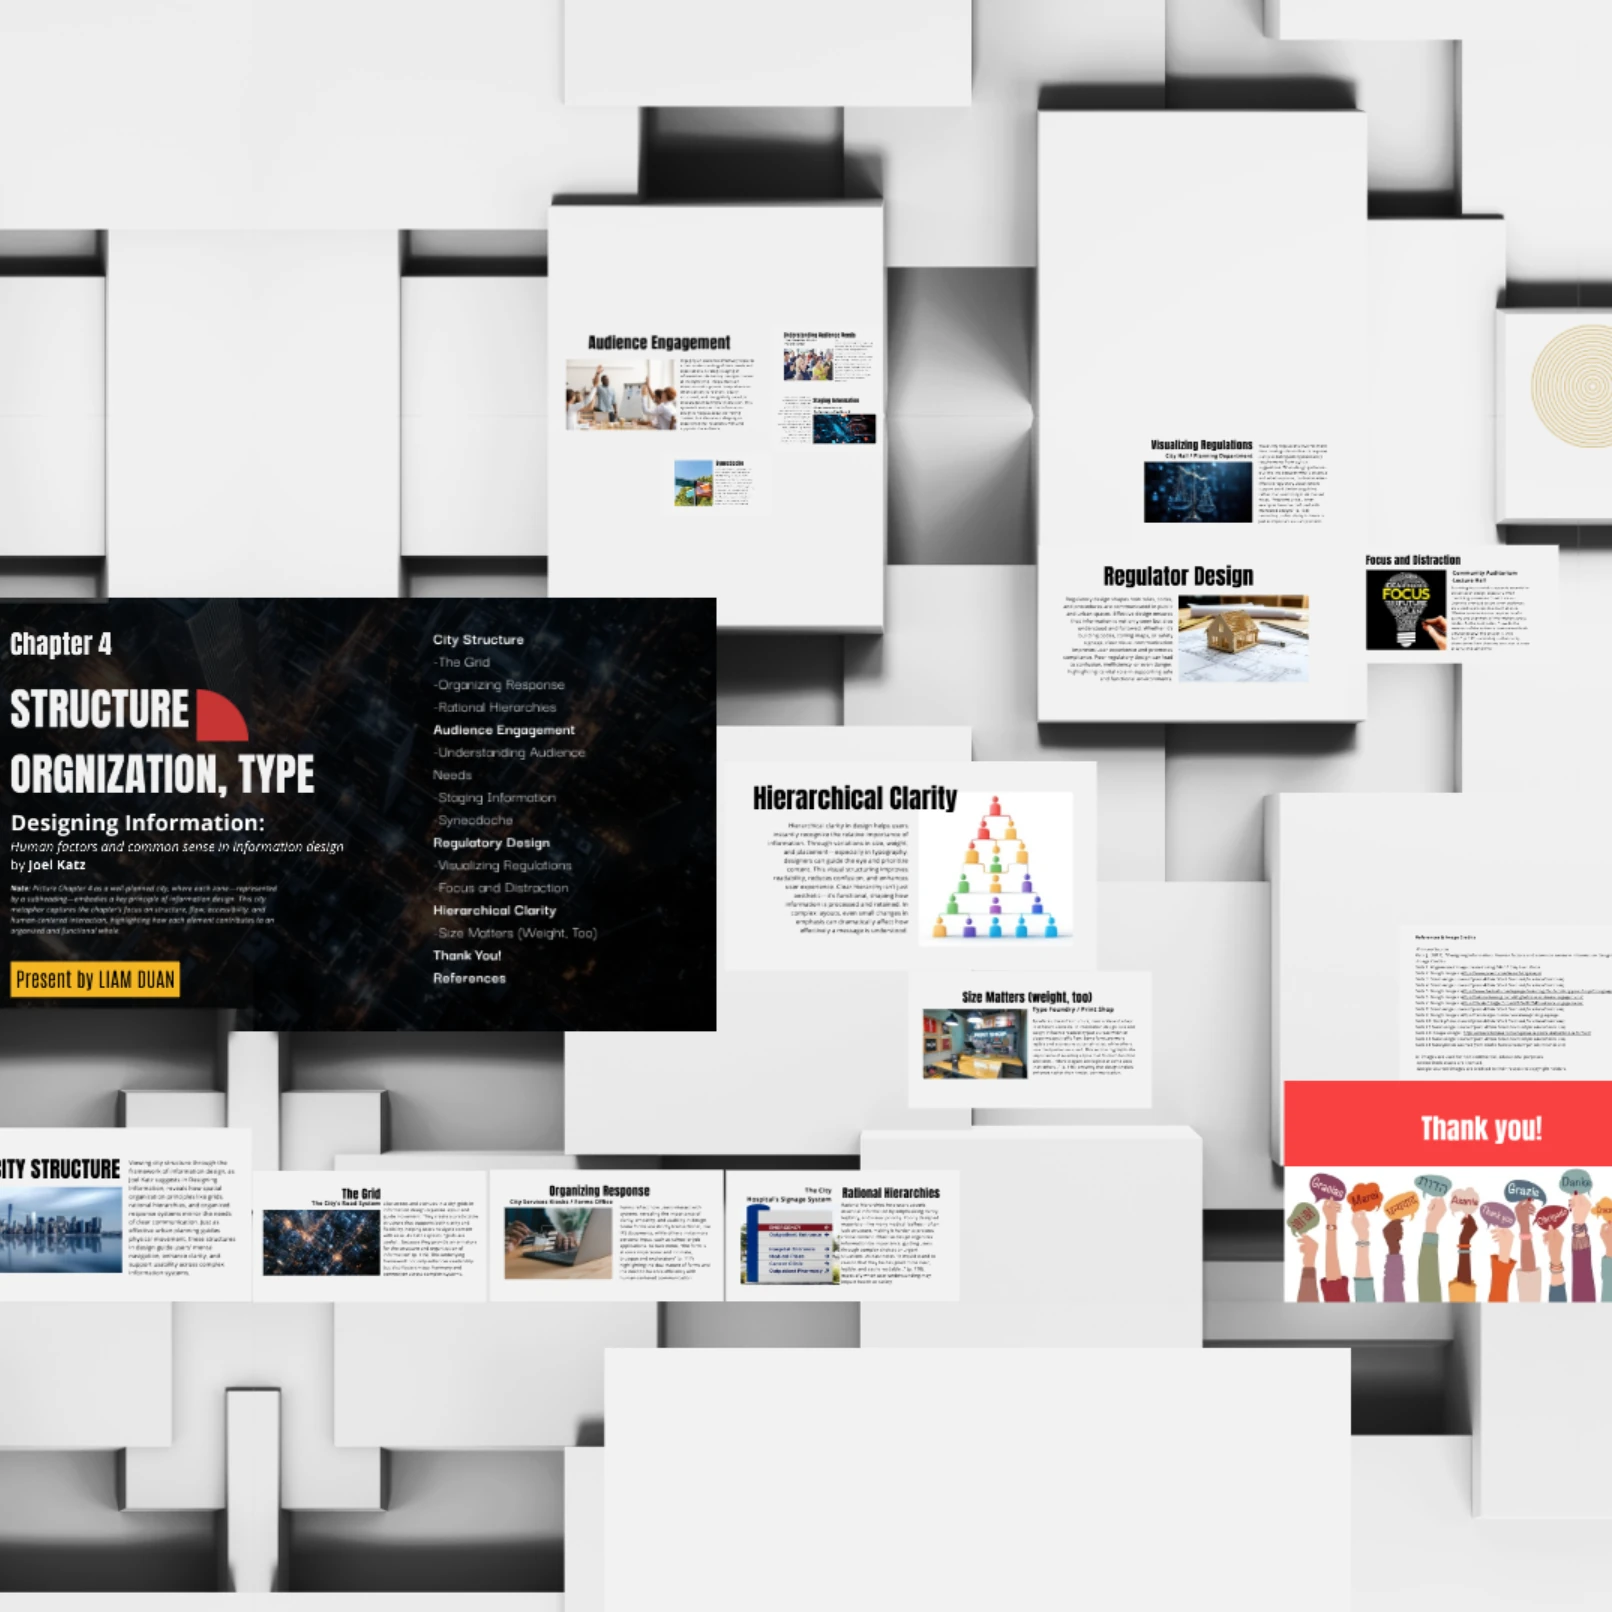
- Interactive presentation projects created with Prezi and web formats
Software
Prezi, Adobe Illustrator, HTML, CSS, visual hierarchy, mapping, sequencing, and information organization.
Selected Coursework Projects
Selected coursework examples showing different approaches to organizing information through timelines, mapping, and interactive visual presentation.